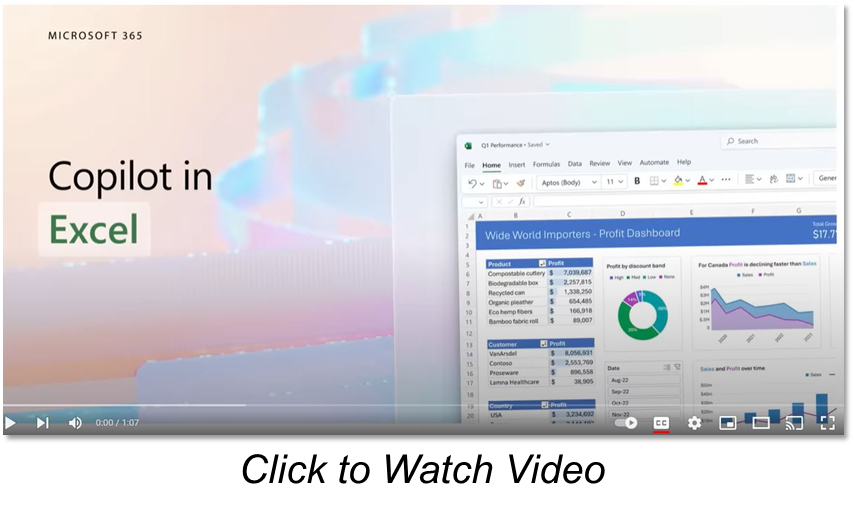
 Using Copilot for Excel
The combination of Copilot and Excel makes data analysis a simple process for all users, especially for those who are less experienced in the use of tables, formulas and graphs. Copilot allows you to view, analyze and transform the data in a spreadsheet, starting from a single prompt. Here are our top 3 Copilot features for Microsoft Excel.
- Intelligent Data Analysis
Users can ask Copilot to analyze the tables in an Excel file to highlight and deepen the most important information. To do this, just click on the Copilot icon and select ‘Analyze’. Some useful prompts are then shown to analyze the data in the table and the chat appears to ask free questions and requests. Once the analysis has been launched, the AI will highlight relevant information based on the prompt and the type of data collected. In addition, it generates a series of contents that the user can use to deepen the analysis, such as:- Charts and visualizations
- Pivot table objects
- Summaries
- Trends and outliers
- Fast Data Modeling
Microsoft 365 Copilot manipulates Excel tables to help users better organize data and identify the most important information. It can then:- Remove unnecessary spaces
- Merge values from different columns
- Highlight and delete duplicates
- Sort the data using the available filters
- Explore possible scenarios and future trends
Regarding the last bullet, it is possible to ask Copilot to model the data based on a variable to visualize, compare and understand from the simulations how to intervene to improve the trend.
- Adding New Column Formulas
Copilot can suggest formulas to use to create new columns in an Excel table. Based on the prompt and the type of data, it proposes useful calculations to combine the values of the columns in the table and create new ones to highlight important information. For example, AI might suggest using a formula to explain the profit of a marketing campaign or the total cost of developing a product.
Need Help Getting Started? Reach out to a member of the BMT team!


